WHAT IS PANDAS
聽到Pandas時你的反應是什麼? 熊貓?功夫熊貓?粉紅色外送平台?

Pandas是一個在資料科學領域中非常重要的工具。 類似試算表的概念,是一個專門用來處理結構化數據的 Python 套件,尤其在資料分析上,會頻繁使用它來進行數據操作
Pandas 的出現是為了填補 Excel 或其他試算表工具的不足。
舉例來說,Excel 在處理大型數據集時常常會受到列數限制或處理效率的影響,
而 Pandas 則能輕鬆應對數百萬甚至上億行的數據。
Excel 雖然可以用 VBA 做一些自動化處理,但相較於程式語言,這種自動化的程度較低。
Pandas 不僅能進行靈活的數據操作,還可以和 Python 的其他工具(如 NumPy、scikit-learn、Matplotlib)整合,這使得我們可以進行完整的數據分析流程。


Start Pandas
會先需要安裝套件,安裝後import pandas 並命名為pd
1
2
| pip install pandas
import pandas as pd
|
取pandas簡寫pd,但如果要很反骨的用其他方式命名也不是不行啦…

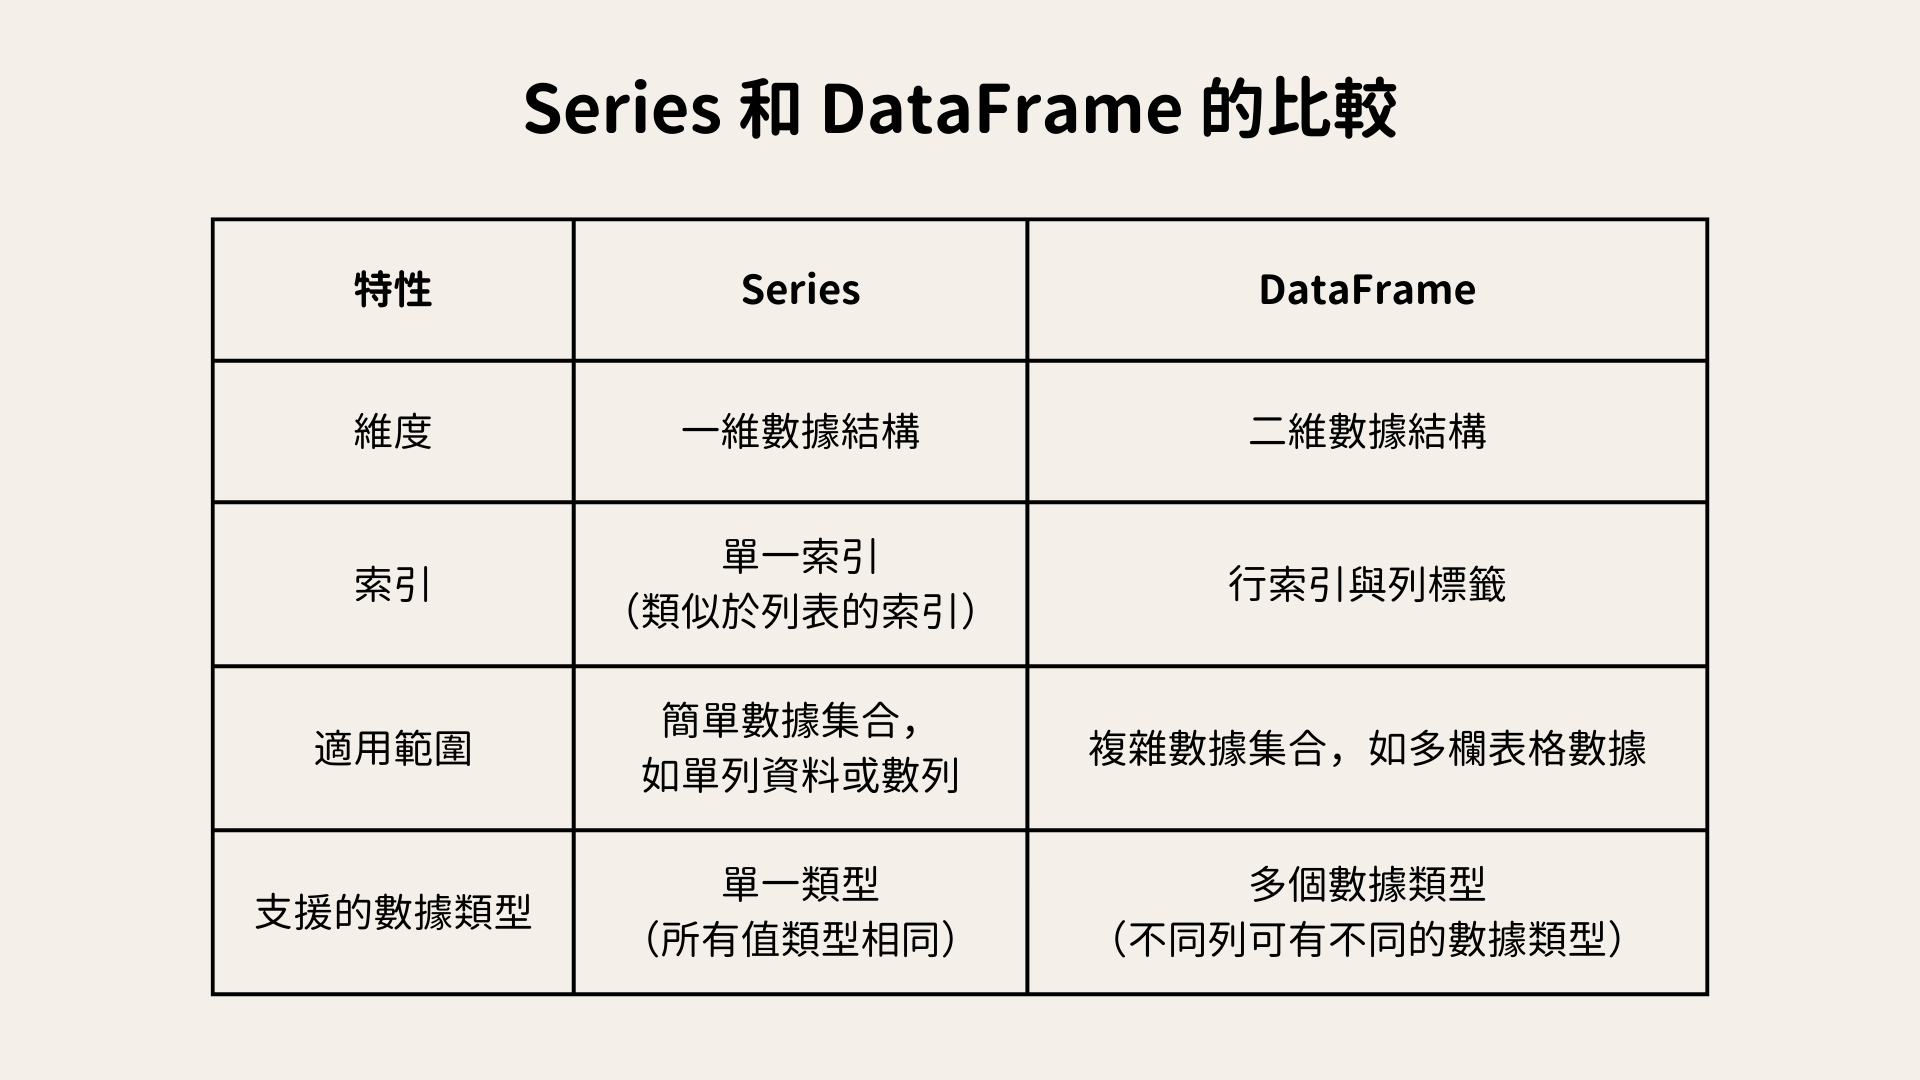
Pandas核心資料結構
Pandas 的核心結構有Series和DataFrame兩種

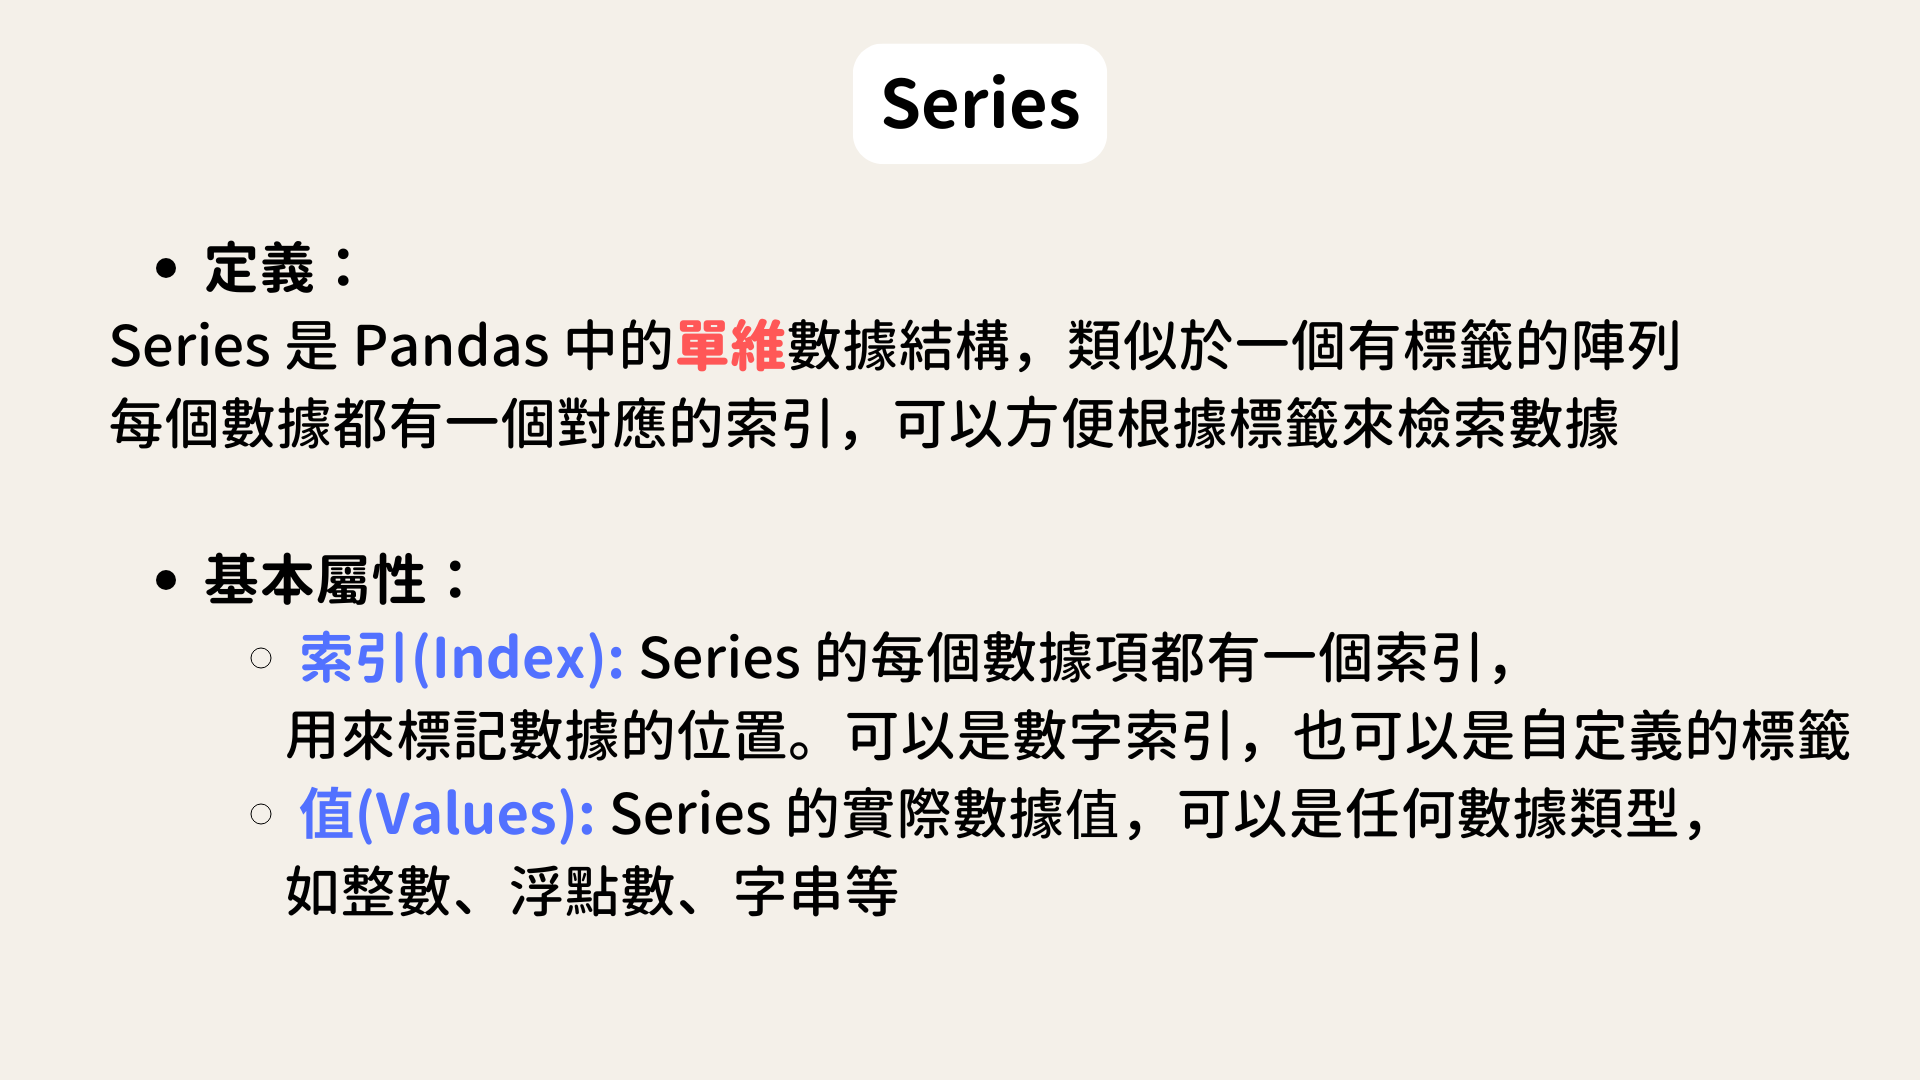
Series
Series 是 Pandas 中的單維度數據結構,類似於一個帶有標籤的陣列。我們可以把它想像成 Excel 表格中的一列。每個數據值都有對應的索引,就像每個單元格都有標籤一樣。索引可以是數字(比如 0, 1, 2…),也可以是自定義標籤(比如姓名)。可以透過索引來檢索某一個特定的數據。
創建一個名為 s 的 Series,數據值是 31, 29, 24, 22,對應的索引是 ‘Anthony’, ‘Benedict’, ‘Collin’, ‘Daphne’。
1
2
| s = pd.Series([31,29,24,22] , index=['Anthony', 'Benedict', 'Collin', 'Daphne'])
print(s)
|
輸出結果看起來就像是一個標籤和數據的對應關係。
1
2
3
4
5
| Anthony 31
Benedict 29
Collin 24
Daphne 22
dtype: int64
|
常見的 Series 操作
選取數據:可以透過索引名稱或位置來選取數據。比如你可以選取 s[‘Anthony’] 或 s[0],兩者都會返回 31。
1
2
| print(s['Anthony']) # 選取索引 'Anthony' 的數據,結果為 31
print(s[0]) # 選取第一個數據,結果為 31
|
31
31
數據運算:Series 支援加減乘除等運算,你可以對整個 Series 進行數值運算,Pandas 會自動保留對應的索引。例如,s + 2 會讓每個數據值都加上 2。
s + 2 每個數據加 2
s.median() 計算中位數
s.max() 找到最大值
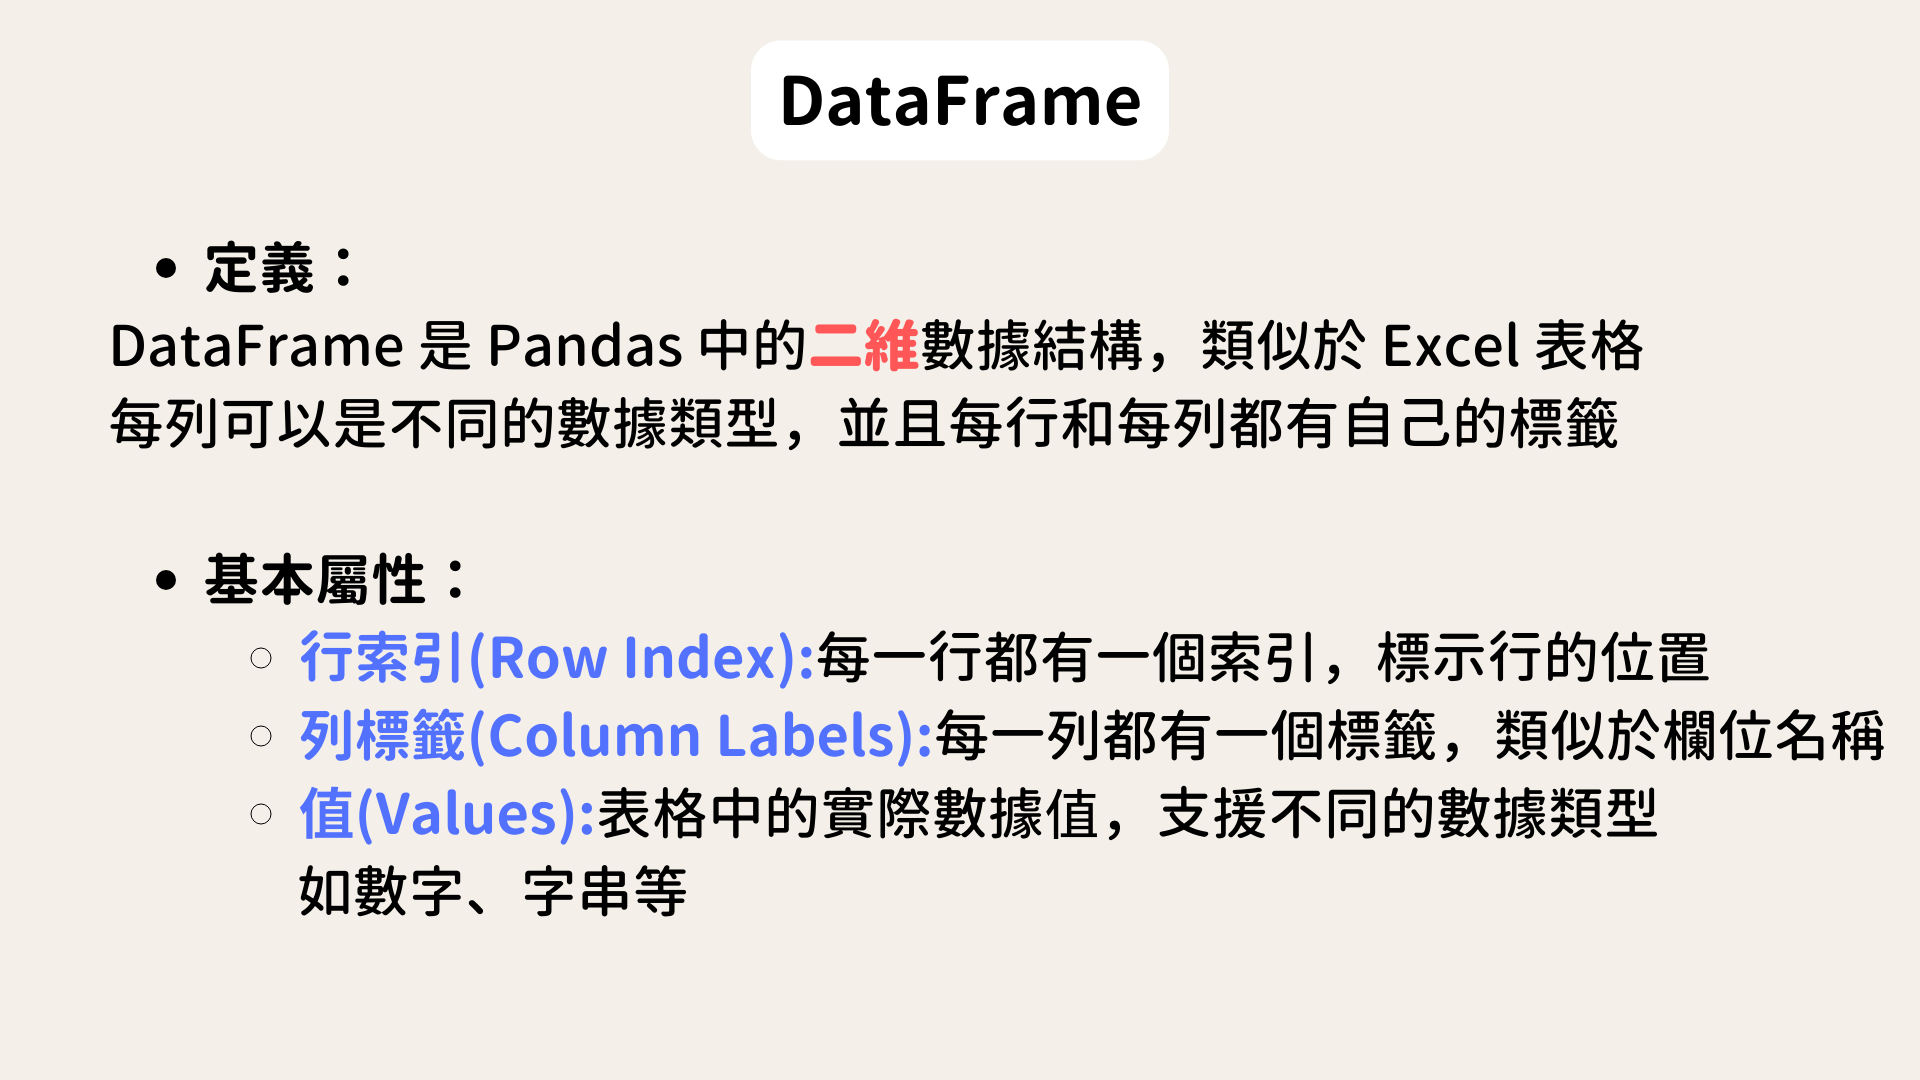
DataFrame
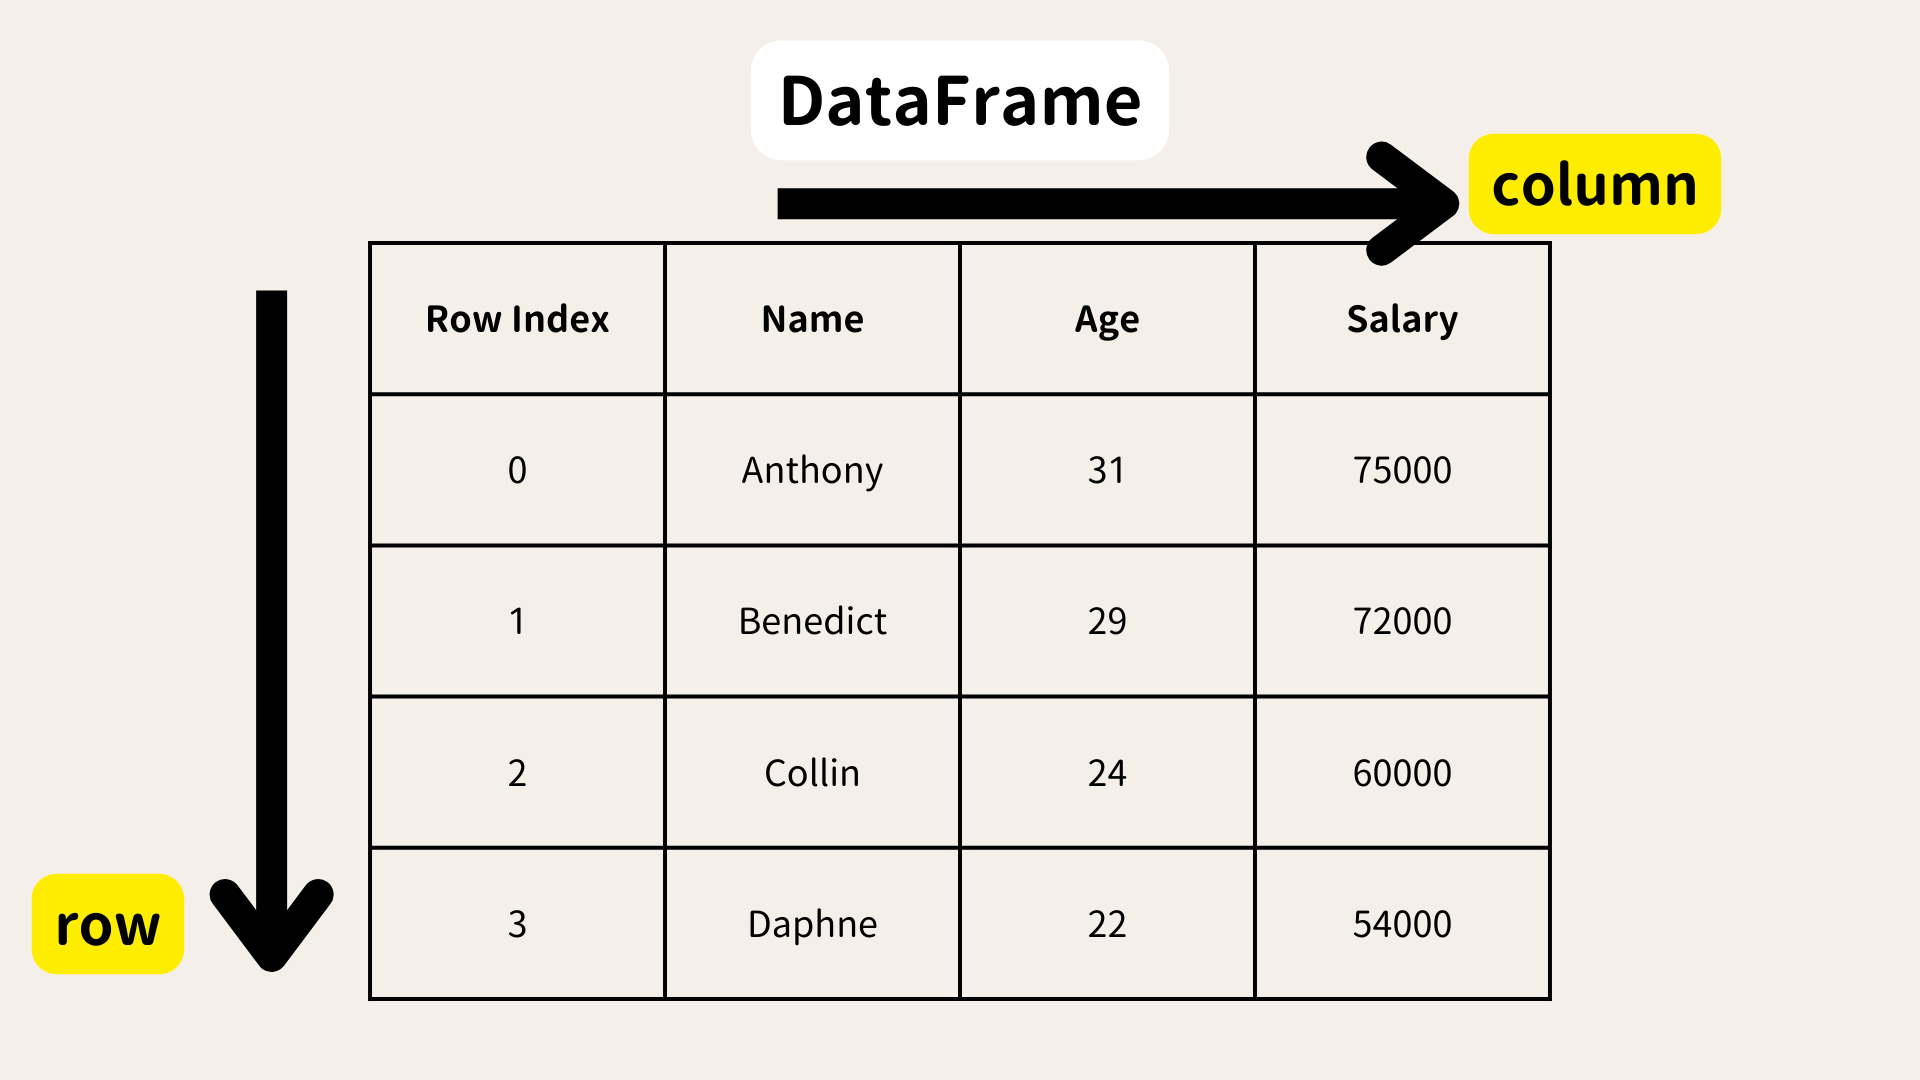
DataFrame 是 Pandas 中的二維度數據結構,類似於完整的試算表資料,有欄和列。
與 Series 不同,DataFrame 可以有多個列,每一列都可以有不同的數據類型。DataFrame 是由行和列組成的,每個行和列都有自己的標籤。
pd.DataFrame(字典) ,以字典的資料為底,建立dataframe
1
2
3
4
5
6
7
8
| import pandas as pd
data = { 'Name': ['Anthony', 'Benedict', 'Collin', 'Daphne'],
'Age': [31,29,24,22],
'Salary': [75000,72000,60000,54000] }
df = pd.DataFrame(data)
print(df)
|
| Name | Age | Salary |
|---|
| 0 | Anthony | 31 | 75000 |
| 1 | Benedict | 29 | 72000 |
| 2 | Collin | 24 | 60000 |
| 3 | Daphne | 22 | 54000 |
創建了一個 DataFrame,包含了三個欄位:Name,Age 和 Salary。每一列數據都可以有不同的類型,比如 Age 是整數,而 Name 是字串
要選取 DataFrame 中的數據,我們可以使用列的名稱來選取特定的數據。
舉個例子:
我們用 df['Name'] 選取了 DataFrame 中的 Name 列
這就像是提取 Excel 表中的某一列。你可以選取多列,使用 df[['Name', 'Salary']] 選取
新增一列的方法很簡單,只需要指定列名,然後為每一行賦值
1
2
| df['Bonus'] = [5000, 6000, 7000 ,8000]
print(df)
|
| Name | Age | Salary | Bonus |
|---|
| 0 | Anthony | 31 | 75000 | 5000 |
| 1 | Benedict | 29 | 72000 | 6000 |
| 2 | Collin | 24 | 60000 | 7000 |
| 3 | Daphne | 22 | 54000 | 8000 |
 1
 2
 3
 4
 5
 6
 7
 8
 9
10
| # Pandas 1.4.0 版本之後,append() 方法已被棄用
new_row = pd.DataFrame({
"Name": ["Ella"],
"Age": [25],
"Salary": [64500],
"Bonus": [1000]
})
df = pd.concat([df, new_row], ignore_index=True) # pd.concat():將原本的 DataFrame 與新增的資料行結合在一起。ignore_index=True 用於重新索引,使新行的索引從 0 開始連續排列。
print(df)
|
| Name | Age | Salary | Bonus |
|---|
| 0 | Anthony | 31 | 75000 | 5000 |
| 1 | Benedict | 29 | 72000 | 6000 |
| 2 | Collin | 24 | 60000 | 7000 |
| 3 | Daphne | 22 | 54000 | 8000 |
1
2
| df1 = df.drop (columns=['Bonus'] )
print(df1)
|
| Name | Age | Salary |
|---|
| 0 | Anthony | 31 | 75000 |
| 1 | Benedict | 29 | 72000 |
| 2 | Collin | 24 | 60000 |
| 3 | Daphne | 22 | 54000 |
| 4 | Ella | 25 | 64500 |
基本上不會刪除到原始資料,若要顯示出刪除後的結果,需要宣告新變數來存取執行結果
資料集實戰練功
匯入實戰資料
出來吧 神奇寶貝!

Pokemon DataSet
匯入資料
- pd.read_csv():用來匯入 CSV 格式的資料
- pd.read_excel():用來匯入 Excel 格式的資料
1
2
| import pandas as pd
df = pd.read_csv("檔案路徑")
|
檢索資料
- df.info():顯示 DataFrame 的基本資訊,包括列數、欄數和每個欄位的數據類型,查看資料的資訊,包括欄位、數據型態、缺失值等
- df.head():取得最前面的n筆資料
- df.tail():取得最後面的n筆資料
- df.column:列出欄位名稱
- df.describe():產生統計摘要,如平均值、最大值、標準差等。
- df.shape:返回資料的行數與列數,了解資料的大小
 1
 2
 3
 4
 5
 6
 7
 8
 9
10
11
12
13
14
15
16
17
18
19
20
| <class 'pandas.core.frame.DataFrame'>
RangeIndex: 800 entries, 0 to 799
Data columns (total 13 columns):
# Column Non-Null Count Dtype
--- ------ -------------- -----
0 # 800 non-null int64
1 Name 800 non-null object
2 Type 1 800 non-null object
3 Type 2 414 non-null object
4 Total 800 non-null int64
5 HP 800 non-null int64
6 Attack 800 non-null int64
7 Defense 800 non-null int64
8 Sp. Atk 800 non-null int64
9 Sp. Def 800 non-null int64
10 Speed 800 non-null int64
11 Generation 800 non-null int64
12 Legendary 800 non-null bool
dtypes: bool(1), int64(9), object(3)
memory usage: 75.9+ KB
|
 1
 2
 3
 4
 5
 6
 7
 8
 9
10
11
12
13
14
15
16
17
18
19
| # Total HP Attack Defense Sp. Atk \
count 800.000000 800.00000 800.000000 800.000000 800.000000 800.000000
mean 362.813750 435.10250 69.258750 79.001250 73.842500 72.820000
std 208.343798 119.96304 25.534669 32.457366 31.183501 32.722294
min 1.000000 180.00000 1.000000 5.000000 5.000000 10.000000
25% 184.750000 330.00000 50.000000 55.000000 50.000000 49.750000
50% 364.500000 450.00000 65.000000 75.000000 70.000000 65.000000
75% 539.250000 515.00000 80.000000 100.000000 90.000000 95.000000
max 721.000000 780.00000 255.000000 190.000000 230.000000 194.000000
Sp. Def Speed Generation
count 800.000000 800.000000 800.00000
mean 71.902500 68.277500 3.32375
std 27.828916 29.060474 1.66129
min 20.000000 5.000000 1.00000
25% 50.000000 45.000000 2.00000
50% 70.000000 65.000000 3.00000
75% 90.000000 90.000000 5.00000
max 230.000000 180.000000 6.00000
|
1
2
| #檢視欄位
print(df.columns)
|
1
2
3
| Index(['#', 'Name', 'Type 1', 'Type 2', 'Total', 'HP', 'Attack', 'Defense',
'Sp. Atk', 'Sp. Def', 'Speed', 'Generation', 'Legendary'],
dtype='object')
|
1
2
| #檢視前10筆資料
df.head(n=10)
|
檢視單個欄位資料
查看某個特定欄位(例如 Name 或 Type 1)的所有值
1
2
| # 查看 'Name' 欄位的所有資料
print(df['Name'])
|
 1
 2
 3
 4
 5
 6
 7
 8
 9
10
11
12
| 0 Bulbasaur
1 Ivysaur
2 Venusaur
3 VenusaurMega Venusaur
4 Charmander
...
795 Diancie
796 DiancieMega Diancie
797 HoopaHoopa Confined
798 HoopaHoopa Unbound
799 Volcanion
Name: Name, Length: 800, dtype: object
|
1
2
| # 查看 'Type 1' 欄位的所有資料
print(df['Type 1'])
|
 1
 2
 3
 4
 5
 6
 7
 8
 9
10
11
12
| 0 Grass
1 Grass
2 Grass
3 Grass
4 Fire
...
795 Rock
796 Rock
797 Psychic
798 Psychic
799 Fire
Name: Type 1, Length: 800, dtype: object
|
檢視單個欄位資料
可以同時查看多個欄位,選取數個你感興趣的欄位作為子集
1
2
| # 查看多個欄位的資料
print(df[['Name', 'HP', 'Attack']])
|
 1
 2
 3
 4
 5
 6
 7
 8
 9
10
11
12
13
14
| Name HP Attack
0 Bulbasaur 45 49
1 Ivysaur 60 62
2 Venusaur 80 82
3 VenusaurMega Venusaur 80 100
4 Charmander 39 52
.. ... .. ...
795 Diancie 50 100
796 DiancieMega Diancie 50 160
797 HoopaHoopa Confined 80 110
798 HoopaHoopa Unbound 80 160
799 Volcanion 80 110
[800 rows x 3 columns]
|
檢視單個欄位資料
可以透過行號來檢視某一特定行的所有資料
1
2
| # 查看第 15 行的所有資料
print(df.iloc[15])
|
 1
 2
 3
 4
 5
 6
 7
 8
 9
10
11
12
13
14
| # 12
Name Butterfree
Type 1 Bug
Type 2 Flying
Total 395
HP 60
Attack 45
Defense 50
Sp. Atk 90
Sp. Def 80
Speed 70
Generation 1
Legendary False
Name: 15, dtype: object
|
1
2
| # 查看指定範圍的行
print(df.iloc[0:5]) # 顯示第 0 到第 4 行
|
 1
 2
 3
 4
 5
 6
 7
 8
 9
10
11
12
13
| # Name Type 1 Type 2 Total HP Attack Defense \
0 1 Bulbasaur Grass Poison 318 45 49 49
1 2 Ivysaur Grass Poison 405 60 62 63
2 3 Venusaur Grass Poison 525 80 82 83
3 3 VenusaurMega Venusaur Grass Poison 625 80 100 123
4 4 Charmander Fire NaN 309 39 52 43
Sp. Atk Sp. Def Speed Generation Legendary
0 65 65 45 1 False
1 80 80 60 1 False
2 100 100 80 1 False
3 122 120 80 1 False
4 60 50 65 1 False
|
根據條件篩選資料(查看子集)
可以根據某個欄位的值來篩選符合條件的行,例如查看所有屬性為 “Legendary” 的 Pokémon
1
2
|
df[df['Legendary']==True].head(15) #Showing the legendary pokemons
|
查看特定欄位的統計資訊
除了 df.describe(),也可以對單個欄位執行統計操作,如查看 Attack 欄位的平均值、最大值等
1
2
3
4
5
| # 計算 'Attack' 欄位的平均值
print(df['Attack'].mean())
# 查看 'Defense' 欄位的最大值
print(df['Defense'].max())
|
79.00125
230
檢視唯一值
查看某個欄位中有哪些唯一值,這對於分類資料(如 Type 2)很有幫助
可以使用 unique() 來查看唯一值:
1
2
3
4
| # 查看 'Type 2' 欄位的所有唯一值
type2_unique = df['Type 2'].unique()
print(type2_unique)
|
[‘Poison’ nan ‘Flying’ ‘Dragon’ ‘Ground’ ‘Fairy’ ‘Grass’ ‘Fighting’
‘Psychic’ ‘Steel’ ‘Ice’ ‘Rock’ ‘Dark’ ‘Water’ ‘Electric’ ‘Fire’ ‘Ghost’
‘Bug’ ‘Normal’]
計算每個分類的出現頻率
可以計算每個分類在資料集中出現的次數,比如我們想知道 ‘Type 1’ 每個分類的出現頻率:
1
2
3
4
| # 計算 'Type 1' 每個分類的出現次數
type1_counts = df['Type 1'].value_counts()
print(type1_counts)
|
 1
 2
 3
 4
 5
 6
 7
 8
 9
10
11
12
13
14
15
16
17
18
19
20
21
22
| type1_counts = df['Type 1'].value_counts()
print(type1_counts)
Type 1
Water 112
Normal 98
Grass 70
Bug 69
Psychic 57
Fire 52
Electric 44
Rock 44
Dragon 32
Ground 32
Ghost 32
Dark 31
Poison 28
Steel 27
Fighting 27
Ice 24
Fairy 17
Flying 4
Name: count, dtype: int64
|
檢視資料摘要(groupby)
想查看特定分類的統計摘要,可以使用 groupby() 來進行分組總結
1
2
3
4
| # 按 'Type 1' 分組,並查看每個屬性的平均攻擊力
grouped_data = df.groupby('Type 1')['Attack'].mean()
print(grouped_data)
|
 1
 2
 3
 4
 5
 6
 7
 8
 9
10
11
12
13
14
15
16
17
18
19
20
| Type 1
Bug 70.971014
Dark 88.387097
Dragon 112.125000
Electric 69.090909
Fairy 61.529412
Fighting 96.777778
Fire 84.769231
Flying 78.750000
Ghost 73.781250
Grass 73.214286
Ground 95.750000
Ice 72.750000
Normal 73.469388
Poison 74.678571
Psychic 71.456140
Rock 92.863636
Steel 92.703704
Water 74.151786
Name: Attack, dtype: float64
|
清理資料(Cleaning DataFrame)
在資料分析過程中,常常需要處理缺失值或重複資料。以下是幾個常用的清理資料的方法:
- df.isnull().sum():檢查資料集中每個欄位有多少缺失值,幫助找出需要清理的部分
- df.dropna():刪除包含缺失值的行,適用於缺失數據較少的情況
- df.fillna(0):將缺失值以指定的數值(如 0)填充,適用於缺失值較多且無法刪除的情況
- df.duplicated().sum():檢查是否有重複的資料行,避免數據重複影響分析結果
- df.drop_duplicates():刪除所有重複行,保留唯一的數據
1
2
| # 檢查是否有缺失值
print(df.isnull().sum())
|
 1
 2
 3
 4
 5
 6
 7
 8
 9
10
11
12
13
14
| # 0
Name 0
Type 1 0
Type 2 386
Total 0
HP 0
Attack 0
Defense 0
Sp. Atk 0
Sp. Def 0
Speed 0
Generation 0
Legendary 0
dtype: int64
|
刪除包含缺失值的行
如果缺失的資料很關鍵且無法推測,可以直接刪除這些包含缺失值的行
1
2
3
4
5
| # 刪除包含缺失值的行
# 這樣會刪除 Type 2 欄位中缺失值的行,並留下屬性完整的資料
df_cleaned = df.dropna(subset=['Type 2'])
print(df_cleaned.info())
|
 1
 2
 3
 4
 5
 6
 7
 8
 9
10
11
12
13
14
15
16
17
18
19
20
21
| <class 'pandas.core.frame.DataFrame'>
Index: 414 entries, 0 to 799
Data columns (total 13 columns):
# Column Non-Null Count Dtype
--- ------ -------------- -----
0 # 414 non-null int64
1 Name 414 non-null object
2 Type 1 414 non-null object
3 Type 2 414 non-null object
4 Total 414 non-null int64
5 HP 414 non-null int64
6 Attack 414 non-null int64
7 Defense 414 non-null int64
8 Sp. Atk 414 non-null int64
9 Sp. Def 414 non-null int64
10 Speed 414 non-null int64
11 Generation 414 non-null int64
12 Legendary 414 non-null bool
dtypes: bool(1), int64(9), object(3)
memory usage: 42.5+ KB
None
|
用特定值填充缺失值
若想保留所有的資料,可以用一個合適的值來填充缺失的部分。
例如,填充為 ‘None’ 表示這些 Pokémon 沒有第二屬性
1
2
3
4
5
| # 使用 'None' 填充缺失的 Type 2 資料
# 可以保留所有的行,並以 'None' 來表示無第二屬性的 Pokémon
df_filled = df.fillna({'Type 2': 'None'})
print(df_filled.head())
|
 1
 2
 3
 4
 5
 6
 7
 8
 9
10
11
12
13
| # Name Type 1 Type 2 Total HP Attack Defense \
0 1 Bulbasaur Grass Poison 318 45 49 49
1 2 Ivysaur Grass Poison 405 60 62 63
2 3 Venusaur Grass Poison 525 80 82 83
3 3 VenusaurMega Venusaur Grass Poison 625 80 100 123
4 4 Charmander Fire None 309 39 52 43
Sp. Atk Sp. Def Speed Generation Legendary
0 65 65 45 1 False
1 80 80 60 1 False
2 100 100 80 1 False
3 122 120 80 1 False
4 60 50 65 1 False
|
使用最常見的值進行填充
如果認為缺失值應該是某個常見的屬性,也可以用該屬性的名稱來填充。例如,填充為最常見的 Type 2 值。
1
2
3
4
| # 使用 'Type 2' 欄位的最常見值進行填充
most_common_type2 = df['Type 2'].mode()[0]
df_filled = df.fillna({'Type 2': most_common_type2})
print(df_filled.head())
|
保留缺失值並進行標記
如果希望保留缺失值,同時也想標記出哪些行有缺失的 Type 2,可以新增一個標記欄位。
1
2
| df['Type 2 Missing'] = df['Type 2'].isnull()
print(df[['Name', 'Type 2', 'Type 2 Missing']].head())
|
1
2
3
4
5
6
| Name Type 2 Type 2 Missing
0 Bulbasaur Poison False
1 Ivysaur Poison False
2 Venusaur Poison False
3 VenusaurMega Venusaur Poison False
4 Charmander NaN True
|
檢查重複值 - df.duplicated().sum()
1
2
| num_duplicates = df.duplicated().sum()
print(f"重複行數:{num_duplicates}")
|
重複行數:0
篩選資料(Filtering DataFrame)
篩選資料是指從一個大的資料集中挑出我們關心的部分,可能是基於特定條件,像是某個欄位的值大於或小於某個數值。這在資料分析中非常重要,因為通常我們只對某些特定條件下的資料感興趣。
- 單一條件篩選:df[df[‘欄位’] > 某值]
- 多重條件篩選:df[(df[‘欄位1’] > 某值) & (df[‘欄位2’] < 某值)]
- 文字篩選:df[df[‘欄位’] == ‘某文字’] 或使用 isin()、str.contains()
- 篩選區間:df[df[‘欄位’].between(開始值, 結束值)]
- 篩選缺失值:df[df[‘欄位’].isnull()] 或 notnull()
- 篩選前 N%:使用 quantile() 來篩選資料的百分比
根據單一條件篩選
可以根據條件,像這個例子中,我們篩選出 HP 值大於 100 的 Pokémon。
1
2
3
| # 篩選出 HP 大於 100 的 Pokémon
high_hp_pokemon = df[df['HP'] > 100]
print(high_hp_pokemon.head())
|
 1
 2
 3
 4
 5
 6
 7
 8
 9
10
11
12
13
| # Name Type 1 Type 2 Total HP Attack Defense Sp. Atk \
44 39 Jigglypuff Normal Fairy 270 115 45 20 45
45 40 Wigglytuff Normal Fairy 435 140 70 45 85
96 89 Muk Poison NaN 500 105 105 75 65
120 112 Rhydon Ground Rock 485 105 130 120 45
121 113 Chansey Normal NaN 450 250 5 5 35
Sp. Def Speed Generation Legendary Type 2 Missing
44 25 20 1 False False
45 50 45 1 False False
96 100 50 1 False True
120 45 40 1 False False
121 105 50 1 False True
|
根據多重條件篩選
1
2
3
| # 篩選出 HP 大於 100 且 Attack 超過 80 的 Pokémon
strong_pokemon = df[(df['HP'] > 100) & (df['Attack'] > 80)]
print(strong_pokemon.head())
|
這裡用到的 & 是 “且” 的意思,代表我們要同時滿足兩個條件,兩個條件必須同時成立:HP > 100 且 Attack > 80。
 1
 2
 3
 4
 5
 6
 7
 8
 9
10
11
12
13
| # Name Type 1 Type 2 Total HP Attack \
96 89 Muk Poison NaN 500 105 105
120 112 Rhydon Ground Rock 485 105 130
123 115 Kangaskhan Normal NaN 490 105 95
124 115 KangaskhanMega Kangaskhan Normal NaN 590 105 125
142 131 Lapras Water Ice 535 130 85
Defense Sp. Atk Sp. Def Speed Generation Legendary Type 2 Missing
96 75 65 100 50 1 False True
120 120 45 45 40 1 False False
123 80 40 80 90 1 False True
124 100 60 100 100 1 False True
142 80 85 95 60 1 False False
|
根據文字內容篩選
有時我們想根據文字內容篩選,例如這裡的例子,我們要篩選出 Type 1 為 ‘Fire’ 的 Pokémon。這時我們可以直接使用條件篩選來進行
1
2
| fire_pokemon = df[df['Type 1'] == 'Fire']
print(fire_pokemon.head())
|
 1
 2
 3
 4
 5
 6
 7
 8
 9
10
11
12
13
| # Name Type 1 Type 2 Total HP Attack Defense \
4 4 Charmander Fire NaN 309 39 52 43
5 5 Charmeleon Fire NaN 405 58 64 58
6 6 Charizard Fire Flying 534 78 84 78
7 6 CharizardMega Charizard X Fire Dragon 634 78 130 111
8 6 CharizardMega Charizard Y Fire Flying 634 78 104 78
Sp. Atk Sp. Def Speed Generation Legendary Type 2 Missing
4 60 50 65 1 False True
5 80 65 80 1 False True
6 109 85 100 1 False False
7 130 85 100 1 False False
8 159 115 100 1 False False
|
多個欄位的條件篩選
有時候我們需要同時根據多個欄位進行篩選,這些欄位的條件可能不相同。比如我們想篩選出 Type 1 為 ‘Water’ 且 Speed 大於 80 的 Pokémon:
1
2
| fast_water_pokemon = df[(df['Type 1'] == 'Water') & (df['Speed'] > 80)]
print(fast_water_pokemon.head())
|
這裡我們用到了兩個條件:一個是 Type 1 為 ‘Water’,另一個是 Speed 大於 80,並且我們用 & 將兩個條件連接在一起,表示這兩個條件都必須滿足。
 1
 2
 3
 4
 5
 6
 7
 8
 9
10
11
12
13
| # Name Type 1 Type 2 Total HP Attack Defense Sp. Atk \
60 55 Golduck Water NaN 500 80 82 78 95
65 60 Poliwag Water NaN 300 40 50 40 40
66 61 Poliwhirl Water NaN 385 65 65 65 50
79 73 Tentacruel Water Poison 515 80 70 65 80
126 117 Seadra Water NaN 440 55 65 95 95
Sp. Def Speed Generation Legendary Type 2 Missing
60 80 85 1 False True
65 40 90 1 False True
66 50 90 1 False True
79 120 100 1 False False
126 45 85 1 False True
|
篩選特定區間的數值
除了篩選固定的數值外,我們還可以篩選區間內的資料。這裡,我們篩選 Attack 值在 50 到 100 之間的 Pokémon:
1
2
| mid_attack_pokemon = df[df['Attack'].between(50, 100)]
print(mid_attack_pokemon.head())
|
.between(50, 100) 是一個很方便的函數,它會幫助我們篩選出 Attack 在 50 到 100 之間的資料。
 1
 2
 3
 4
 5
 6
 7
 8
 9
10
11
12
13
| # Name Type 1 Type 2 Total HP Attack Defense \
1 2 Ivysaur Grass Poison 405 60 62 63
2 3 Venusaur Grass Poison 525 80 82 83
3 3 VenusaurMega Venusaur Grass Poison 625 80 100 123
4 4 Charmander Fire NaN 309 39 52 43
5 5 Charmeleon Fire NaN 405 58 64 58
Sp. Atk Sp. Def Speed Generation Legendary Type 2 Missing
1 80 80 60 1 False False
2 100 100 80 1 False False
3 122 120 80 1 False False
4 60 50 65 1 False True
5 80 65 80 1 False True
|
篩選出缺失值的資料
在真實世界的資料中,經常會遇到缺失值。這時我們可能需要篩選出包含缺失值的資料,像這裡篩選出 Type 2 欄位缺失的 Pokémon:
1
2
| missing_type2_pokemon = df[df['Type 2'].isnull()]
print(missing_type2_pokemon.head())
|
.isnull() 函數會返回一個布林值,True 表示該欄位的值為缺失值,因此我們篩選出來的是 Type 2 欄位為空的資料。
 1
 2
 3
 4
 5
 6
 7
 8
 9
10
11
12
13
| # Name Type 1 Type 2 Total HP Attack Defense Sp. Atk Sp. Def \
4 4 Charmander Fire NaN 309 39 52 43 60 50
5 5 Charmeleon Fire NaN 405 58 64 58 80 65
9 7 Squirtle Water NaN 314 44 48 65 50 64
10 8 Wartortle Water NaN 405 59 63 80 65 80
11 9 Blastoise Water NaN 530 79 83 100 85 105
Speed Generation Legendary Type 2 Missing
4 65 1 False True
5 80 1 False True
9 43 1 False True
10 58 1 False True
11 78 1 False True
|
根據多個選項篩選
可以使用 isin() 函數來篩選出符合多個選項的資料。例如,篩選出屬性為 “Fire” 或 “Water” 的 Pokémon
1
2
| fire_water_pokemon = df[df['Type 1'].isin(['Fire', 'Water'])]
print(fire_water_pokemon.head())
|
isin() 函數可以幫助我們在多個選項中進行篩選。這個例子篩選出的是 Type 1 屬於 ‘Fire’ 或 ‘Water’ 的資料。
 1
 2
 3
 4
 5
 6
 7
 8
 9
10
11
12
13
| # Name Type 1 Type 2 Total HP Attack Defense \
4 4 Charmander Fire NaN 309 39 52 43
5 5 Charmeleon Fire NaN 405 58 64 58
6 6 Charizard Fire Flying 534 78 84 78
7 6 CharizardMega Charizard X Fire Dragon 634 78 130 111
8 6 CharizardMega Charizard Y Fire Flying 634 78 104 78
Sp. Atk Sp. Def Speed Generation Legendary Type 2 Missing
4 60 50 65 1 False True
5 80 65 80 1 False True
6 109 85 100 1 False False
7 130 85 100 1 False False
8 159 115 100 1 False False
|
根據字串條件篩選
有時我們可能需要篩選包含某個字串的資料。例如篩選出名字中包含 ‘Mega’ 的 Pokémon:
1
2
| mega_pokemon = df[df['Name'].str.contains('Mega')]
print(mega_pokemon.head())
|
 1
 2
 3
 4
 5
 6
 7
 8
 9
10
11
12
13
| # Name Type 1 Type 2 Total HP Attack Defense \
3 3 VenusaurMega Venusaur Grass Poison 625 80 100 123
7 6 CharizardMega Charizard X Fire Dragon 634 78 130 111
8 6 CharizardMega Charizard Y Fire Flying 634 78 104 78
12 9 BlastoiseMega Blastoise Water NaN 630 79 103 120
19 15 BeedrillMega Beedrill Bug Poison 495 65 150 40
Sp. Atk Sp. Def Speed Generation Legendary Type 2 Missing
3 122 120 80 1 False False
7 130 85 100 1 False False
8 159 115 100 1 False False
12 135 115 78 1 False True
19 15 80 145 1 False False
|
篩選出資料的前 N%
有時可能需要篩選出資料集中數值最高或最低的前幾個百分比。例如,篩選出攻擊力最高的前 10% Pokémon
1
2
| top_10_percent_attack = df[df['Attack'] > df['Attack'].quantile(0.9)]
print(top_10_percent_attack.head())
|
quantile() 是 用來計算指定百分比位置數值的函數。這個函數的功能是告訴你一組數據中,在某個百分比對應的數值是多少。比如當你設定 0.9,這表示你想知道數據集中位於前 90% 的臨界值是多少。
簡單來說,quantile(0.9) 就是幫你找到數據中排在前 90% 位置的值。
- df[‘Attack’].quantile(0.9):計算 Attack 欄位中,位於前 90% 的臨界值。例如,如果 Attack 最大是 150,最小是 20,這個函數可能會告訴我們前 90% 對應的攻擊值是 120。也就是說,攻擊力在 120 以上的寶可夢屬於前 10%。
- df[‘Attack’] > df[‘Attack’].quantile(0.9):找出那些攻擊力大於剛才計算出來的 90% 臨界值的寶可夢。它會產生一個布林值的 Series,顯示哪一筆資料符合這個條件。
 1
 2
 3
 4
 5
 6
 7
 8
 9
10
11
12
13
| # Name Type 1 Type 2 Total HP Attack \
7 6 CharizardMega Charizard X Fire Dragon 634 78 130
19 15 BeedrillMega Beedrill Bug Poison 495 65 150
74 68 Machamp Fighting NaN 505 90 130
107 99 Kingler Water NaN 475 55 130
120 112 Rhydon Ground Rock 485 105 130
Defense Sp. Atk Sp. Def Speed Generation Legendary Type 2 Missing
7 111 130 85 100 1 False False
19 40 15 80 145 1 False False
74 80 65 85 55 1 False True
107 115 50 50 75 1 False True
120 120 45 45 40 1 False False
|
排序資料(Sorting DataFrame)
- df.sort_values(‘欄位’):根據指定的欄位進行排序,默認為升序排列。
*ascending=True:指定排序方向為升序。若要降序,將 ascending 設為 False
根據單一欄位排序
1
2
3
| # 根據 Attack 欄位進行升序排序
df_sorted_attack = df.sort_values('Attack', ascending=True)
print(df_sorted_attack.head())
|
 1
 2
 3
 4
 5
 6
 7
 8
 9
10
11
12
13
| # Name Type 1 Type 2 Total HP Attack Defense Sp. Atk \
488 440 Happiny Normal NaN 220 100 5 5 15
121 113 Chansey Normal NaN 450 250 5 5 35
230 213 Shuckle Bug Rock 505 20 10 230 10
261 242 Blissey Normal NaN 540 255 10 10 75
139 129 Magikarp Water NaN 200 20 10 55 15
Sp. Def Speed Generation Legendary Type 2 Missing
488 65 30 4 False True
121 105 50 1 False True
230 230 5 2 False False
261 135 55 2 False True
139 20 80 1 False True
|
根據多個欄位進行排序
不僅可以根據單一欄位排序,也可以根據多個欄位進行排序。這在分析時是非常有用的。
例如,先根據 Pokémon 的攻擊力(Attack)進行升序排序,若攻擊力相同,再根據防禦力(Defense)進行降序排序。
1
2
3
| # 根據 Attack 升序,Defense 降序進行排序
df_sorted_multi = df.sort_values(['Attack', 'Defense'], ascending=[True, False])
print(df_sorted_multi.head())
|
 1
 2
 3
 4
 5
 6
 7
 8
 9
10
11
12
13
| # Name Type 1 Type 2 Total HP Attack Defense Sp. Atk \
121 113 Chansey Normal NaN 450 250 5 5 35
488 440 Happiny Normal NaN 220 100 5 5 15
230 213 Shuckle Bug Rock 505 20 10 230 10
139 129 Magikarp Water NaN 200 20 10 55 15
261 242 Blissey Normal NaN 540 255 10 10 75
Sp. Def Speed Generation Legendary Type 2 Missing
121 105 50 1 False True
488 65 30 4 False True
230 230 5 2 False False
139 20 80 1 False True
261 135 55 2 False True
|
根據索引排序
可以根據 DataFrame 的索引(行標籤)進行排序。這有助於根據行索引進行重整或檢查資料順序
1
2
3
4
5
6
7
| # 根據索引進行升序排序
df_sorted_index = df.sort_index()
print(df_sorted_index.head())
# 根據索引降序排序
df_sorted_index_desc = df.sort_index(ascending=False)
print(df_sorted_index_desc.head())
|
 1
 2
 3
 4
 5
 6
 7
 8
 9
10
11
12
13
| # Name Type 1 Type 2 Total HP Attack Defense \
0 1 Bulbasaur Grass Poison 318 45 49 49
1 2 Ivysaur Grass Poison 405 60 62 63
2 3 Venusaur Grass Poison 525 80 82 83
3 3 VenusaurMega Venusaur Grass Poison 625 80 100 123
4 4 Charmander Fire NaN 309 39 52 43
Sp. Atk Sp. Def Speed Generation Legendary Type 2 Missing
0 65 65 45 1 False False
1 80 80 60 1 False False
2 100 100 80 1 False False
3 122 120 80 1 False False
4 60 50 65 1 False True
|
 1
 2
 3
 4
 5
 6
 7
 8
 9
10
11
12
13
| # Name Type 1 Type 2 Total HP Attack Defense \
799 721 Volcanion Fire Water 600 80 110 120
798 720 HoopaHoopa Unbound Psychic Dark 680 80 160 60
797 720 HoopaHoopa Confined Psychic Ghost 600 80 110 60
796 719 DiancieMega Diancie Rock Fairy 700 50 160 110
795 719 Diancie Rock Fairy 600 50 100 150
Sp. Atk Sp. Def Speed Generation Legendary Type 2 Missing
799 130 90 70 6 True False
798 170 130 80 6 True False
797 150 130 70 6 True False
796 160 110 110 6 True False
795 100 150 50 6 True False
|
sort_index() 和 sort_values() 的比較
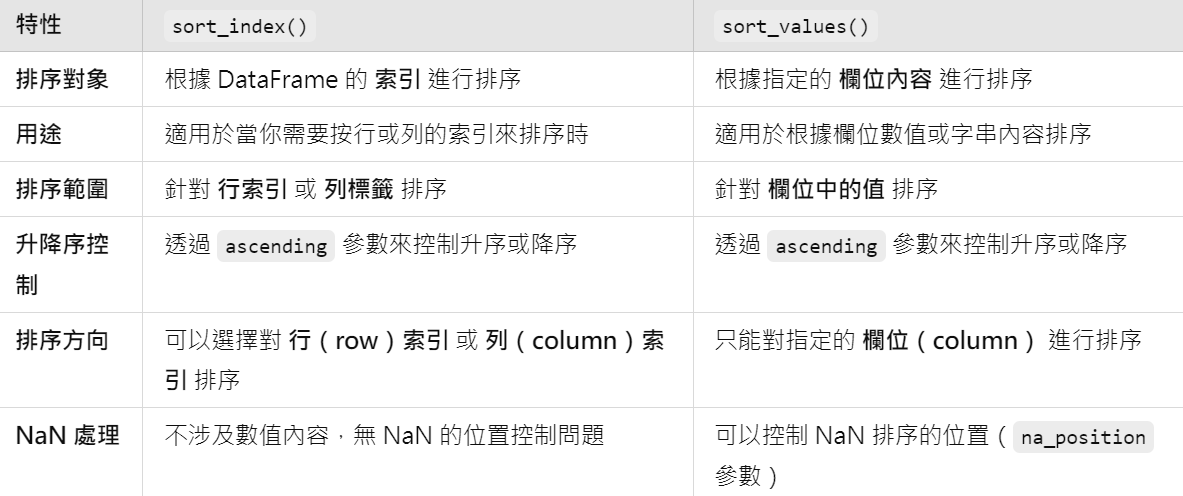
- sort_index() 是用來針對DataFrame 的索引進行排序,這在需要按照行或列的索引順序(如按時間、ID 等)進行排序時非常有用。它不關注欄位的具體數值,而是針對 DataFrame 的結構順序進行操作。
- sort_values() 是用來根據指定的欄位內容進行排序,當你需要根據某個數據欄位(如攻擊力、價格等)來排序資料時,這個函數就很有用。
輸出資料
可以使用 DataFrame.to_csv(‘檔案名稱’)、DataFrame.to_json(‘檔案名稱’)、DataFrame.to_excel(‘檔案名稱) 和 DataFrame.to_html(‘檔案名稱’) 將資料轉成檔案
參數說明:
- sep:設定欄位的分隔符,預設為逗號(,)。
- index:是否寫入索引列,預設為 True。可以設定為 False,以避免寫入行索引。
- header:是否寫入列名稱,預設為 True。可以設定為 False,以避免寫入列名稱。
- encoding:設定檔案編碼格式,預設為 utf-8。可以根據需求調整編碼格式。
- mode:寫入模式。預設為 ‘w’(覆蓋寫入)。可以設定為 ‘a’ 以追加模式寫入檔案。
- decimal:設定浮點數的小數點分隔符,預設為 .。
CSV 格式輸出
1
2
| # 基本用法
df.to_csv('file_name.csv')
|
1
2
| # 不寫入索引、沒有標題行,並用 UTF-16 編碼保存
df.to_csv('file_name.csv', index=False, header=False, encoding='utf-16')
|
Excel 格式輸出
1
2
| # 基本用法
df.to_excel('file_name.xlsx')
|
1
2
| # 輸出到 Excel 並指定工作表名稱
df.to_excel('file_name.xlsx', sheet_name='Sheet1', index=False)
|
I hope this will help u know more about Pandas,
And check out the Pandas AI at next article ~ Byeeee